Python basics
Goals
Understand the types of Python variables that will be used most throughout the course
Understand the most common cases of flow control in Python programs
Create elementary graphics using the Matplotlib package
Loading packages
import numpy as np
import pandas as pd
import matplotlib.pyplot as plt
import glob
Arrays
Python arrays
x = [1, 2, 3]
y = 2*x
print(x)
print(y)
[1, 2, 3]
[1, 2, 3, 1, 2, 3]
x+x
[1, 2, 3, 1, 2, 3]
x[2] # elementos de x
3
Numpy arrays
x = np.array([1, 2, 3])
y = 2*x
print(x)
print(y)
print(x+y)
[1 2 3]
[2 4 6]
[3 6 9]
Soma de vetores é realizada element-wise:
x+y
array([3, 6, 9])
Vetores podem ser criados de diversas formas:
vetores com espaçamento linear;
vetores com espaçamento logarítmico;
Vetor com 19 elementos no intervalo \(1\leq x \leq10\)
x = np.linspace(1,10,19)
print(x)
print(len(x))
[ 1.   1.5  2.   2.5  3.   3.5  4.   4.5  5.   5.5  6.   6.5  7.   7.5
  8.   8.5  9.   9.5 10. ]
19
Vetor com com espaçamento de 0.5 no intervalo \(1\leq x <10\)
x = np.arange(1,10,0.5) # vetor com 19 elementos entre 1 e 10
print(x)
print(len(x))
[1.  1.5 2.  2.5 3.  3.5 4.  4.5 5.  5.5 6.  6.5 7.  7.5 8.  8.5 9.  9.5]
18
As you see above, native Python and Numpy arrays behave very differently, so be careful!
Exercise 1 (Construindo um vetor)
Crie um vetor linearmente espaçado no intervalo \(0\leq x \leq 20\) contendo 100
Crie um vetor linearmente espaçado no intervalo \(0\leq x \leq 20\) com espaçamento \(\delta x=1\)
Flow control
list(range(3))
[0, 1, 2]
for i in range(3):
  print(i)
  print(i+1)
2+5
0
1
1
2
2
3
7
for i in range(4):
  print(i)
  if i==2:
    print("2 is great")
  else:
    print("others are also great")
0
others are also great
1
others are also great
2
2 is great
3
others are also great
for i in range(4):
  print(i)
  if i==2:
    print("2 is great")
  elif i==3: # else if
    print("3 is also great")
print(2+2)
0
1
2
2 is great
3
3 is also great
4
i=0
while i < 5:
  print(i)
  i += 1 #increase i by 1
0
1
2
3
4
Other forms of iteration
np.array([i+2 for i in range(4)])
array([2, 3, 4, 5])
Functions
def helloworld():
  print('helloworld')
def soma(x,y):
  return x+y
def reta(x,a,b):
  return a*x+b


helloworld()
soma(2,3)
helloworld
5
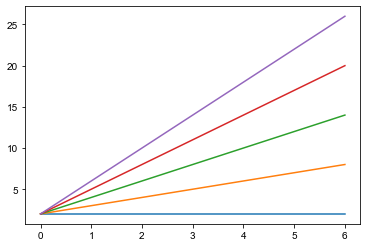
x = np.linspace(0,6,10)
for a in range(0,5):
  plt.plot(x,reta(x,a,2))

Simple plots
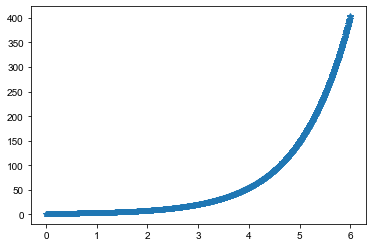
x = np.linspace(0,6,1000)
plt.plot(x,np.exp(x),'*')
[<matplotlib.lines.Line2D at 0x7f8952a8fa50>]

Adjusting standard plot configurations
#****************************
# Setting up plot configurations
# Configurando gráficos
#****************************
#Adjusting fonts pattern
#Ajsutando fontes padrão dos gráficos
font = { 'weight' : 'normal',
        'size'   : 12}

plt.rc('font', **font)
#Ajsutando espessura das linhas padrão dos gráficos
plt.rcParams['lines.linewidth'] = 2;
Loading data (Google colab)
import glob
import pandas as pd
# Para usuários do Google Cola
from google.colab import drive
drive.mount('/content/drive')
---------------------------------------------------------------------------
ModuleNotFoundError                       Traceback (most recent call last)
<ipython-input-20-c2bf9b53f311> in <module>
      1 # Para usuários do Google Cola
----> 2 from google.colab import drive
      3 drive.mount('/content/drive')

ModuleNotFoundError: No module named 'google'
files = glob.glob('drive/My Drive/Colab Notebooks/F540/2021_1s/*')
print(files)
['drive/My Drive/Colab Notebooks/F540/2021_1s/exemplo_qucs_ganho.csv', 'drive/My Drive/Colab Notebooks/F540/2021_1s/exemplo_qucs_fase.csv']
dataG = pd.read_csv(files[0],sep=';')
dataG.head() # visualize first lines
| acfrequency | r Gv | i Gv | |
|---|---|---|---|
| 0 | 1.00000 | -0.000014 | 0 |
| 1 | 1.12332 | -0.000018 | 0 |
| 2 | 1.26186 | -0.000022 | 0 |
| 3 | 1.41747 | -0.000028 | 0 |
| 4 | 1.59228 | -0.000035 | 0 |
dataG.columns # list column names
Index(['acfrequency', 'r Gv', 'i Gv'], dtype='object')
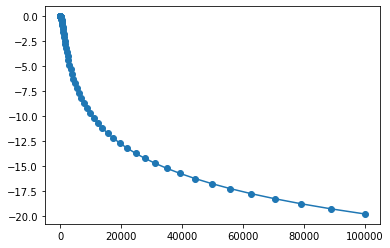
plt.plot(dataG['acfrequency'],dataG['r Gv'],'o-')
[<matplotlib.lines.Line2D at 0x7f3241589fd0>]

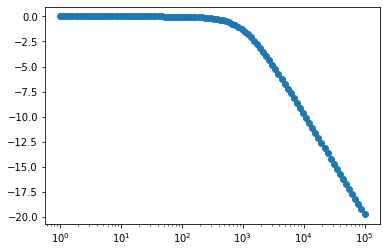
plt.semilogx(dataG['acfrequency'],dataG['r Gv'],'o-')
[<matplotlib.lines.Line2D at 0x7f3241516190>]

